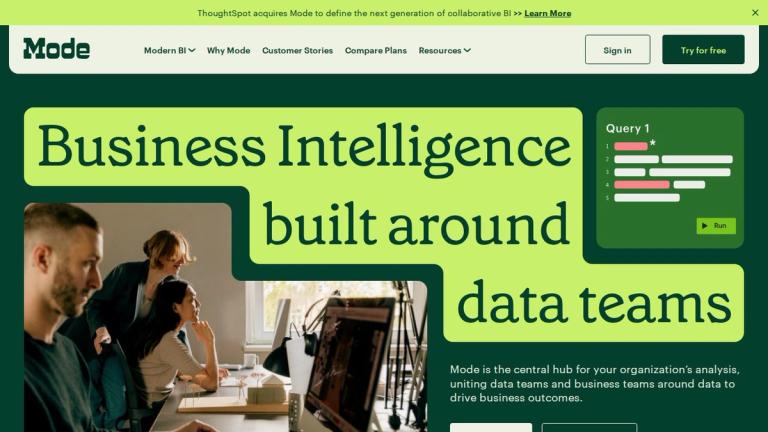
Mode Analytics
Mode Analytics is a collaborative analytics platform designed to empower data teams and business users to explore, analyze, and share data insights efficiently. The platform combines a powerful SQL editor, Python and R notebooks, and interactive dashboards in a unified workspace.
Overview
Mode provides an integrated environment where data analysts can write queries, build visualizations, and create reports that can be shared across organizations. The platform is built to streamline the analytics workflow from data exploration to decision-making.
Key Capabilities
- SQL Editor: A robust SQL editor with autocomplete, version history, and collaboration features
- Notebooks: Integrated Python and R notebooks for advanced analytics and machine learning
- Interactive Dashboards: Drag-and-drop dashboard builder with real-time data updates
- Collaboration Tools: Team-based features for sharing, commenting, and iterating on analyses
- Data Connectivity: Connects to major data warehouses including Snowflake, BigQuery, Redshift, and more
Target Users
Mode is primarily used by data analysts, data scientists, and business intelligence teams who need a collaborative platform for exploratory analysis and reporting.
Target Audience
Data analysts, data scientists, business intelligence teams, and data-driven organizations.
Key Features
- SQL Editor with autocomplete and version control
- Python and R notebook integration
- Interactive dashboard builder
- Real-time data visualization
- Team collaboration and sharing
- Data warehouse connectivity
- Scheduled reports and alerts
- Embeddable analytics
- Custom visualization library
- Git integration for version control
Use Cases
- Data exploration and ad-hoc analysis
- Business intelligence reporting
- Dashboard creation for stakeholders
- Collaborative data analysis
- Data science workflows
- Executive reporting
- Marketing analytics
- Product analytics
- Financial reporting
- Customer analytics
Pros
- Excellent SQL editor with modern features
- Seamless Python/R integration for advanced analytics
- Strong collaboration capabilities
- Clean, intuitive interface
- Good data warehouse integrations
- Supports both technical and business users
Cons
- Can be expensive for smaller teams
- Learning curve for advanced features
- Limited visualization customization compared to specialized BI tools
- Performance can slow with very large datasets
Pricing
Custom pricing based on team size and features; typically enterprise-focused with quotes available upon request.