Datawrapper
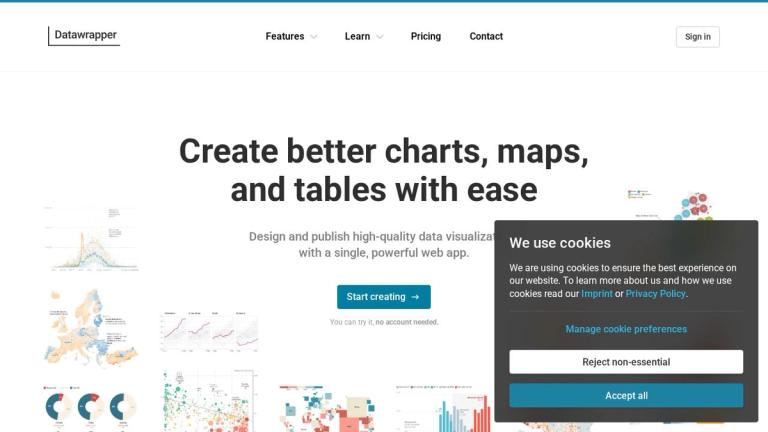
Datawrapper is a powerful web-based data visualization tool that enables users to create professional charts, maps, and tables with ease. Designed for both individuals and teams, Datawrapper streamlines the process from data to publication, allowing users to design and publish high-quality visualizations without requiring technical expertise.
Key Highlights
- No Account Required: Users can start creating visualizations immediately without signing up
- Multi-Platform Publishing: Export and embed visualizations across websites, presentations, printed publications, and mobile devices
- Professional Quality: Every element is carefully optimized for the best possible display, from layout and typography to legends, axes, and tooltips
- Accessibility First: Built with accessibility in mind, featuring non-overlapping labels, smart annotations, and color-accessible defaults
- Brand Customization: Custom themes allow organizations to maintain consistent branding across all visualizations
- Team Collaboration: Powerful collaborative editing features with shared templates, custom themes, and default settings to ensure consistency across teams
How It Works
Datawrapper guides users through a step-based workflow that takes them from raw data to polished publication. The editor provides fine-grained customization controls and responsive previews that show how visualizations will look across different screen sizes.
Target Audience
Journalists, data analysts, marketing teams, organizations needing consistent data visualizations, and anyone who needs to present data professionally.
Key Features
- Create charts, maps, and tables
- Multi-platform export (Mobile, Web, PowerPoint, Print)
- Custom brand themes and templates
- Step-based workflow editor
- Responsive preview across device sizes
- Fine-grained customization controls
- Team collaboration with shared settings
- One-click publishing and updates
- Accessible visualizations by default
- No account required to start
Use Cases
- Creating data visualizations for news articles and publications
- Building interactive charts for websites
- Designing maps for geographic data presentation
- Producing print-ready visualizations for reports
- Creating presentation slides with data graphics
- Team-based visualization workflows in organizations
- Publishing responsive data stories for mobile audiences
Pros
- Easy to use with no technical expertise required
- Free to try without account creation
- Professional-quality output with attention to detail
- Excellent accessibility features built-in
- Strong team collaboration capabilities
- Flexible export options for multiple platforms
- Custom themes for brand consistency
Cons
- Web-based tool requires internet connection
- Advanced features may require paid plans for teams
Pricing
Free to try with no account required. Team and enterprise plans available for advanced features and collaboration.